Weather Variations and Participation Trends in Digital Table Games
Written by Xander Keller · Aug 2, 2026
Weather Variations and Participation Trends in Digital Table Games
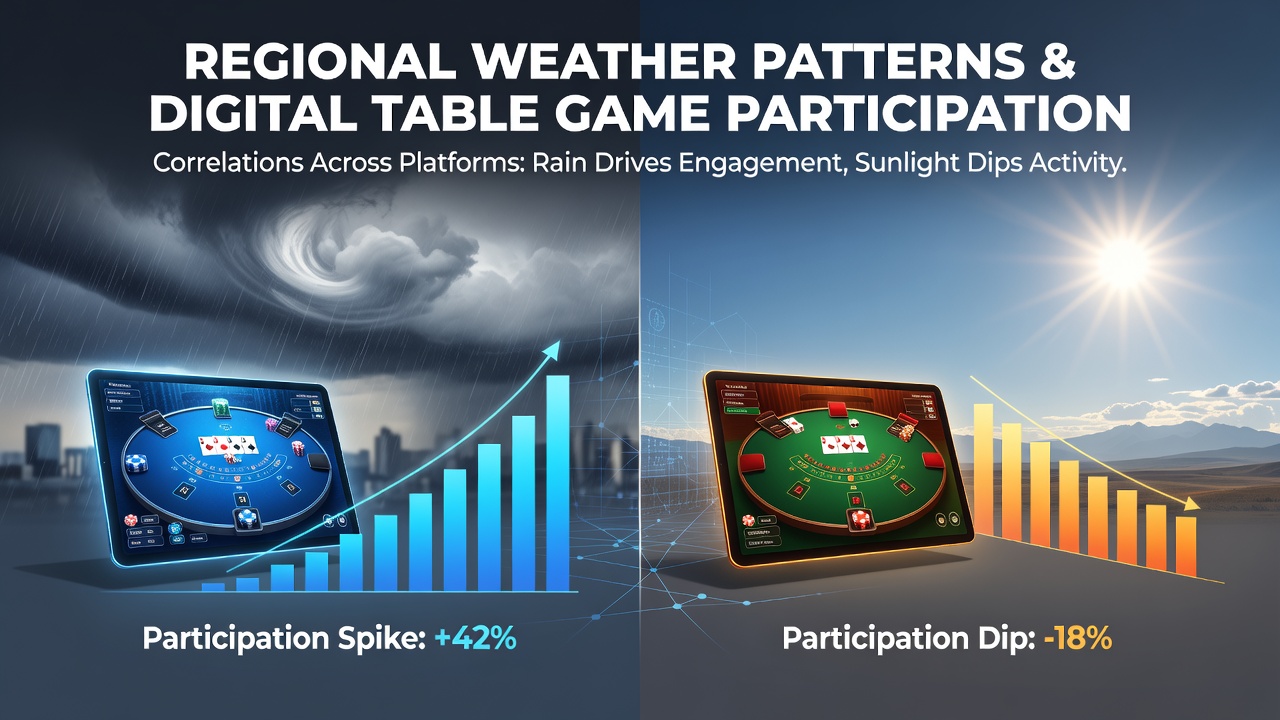
Regional weather patterns show measurable connections to changes in digital table game participation rates on multiple online platforms, according to aggregated user activity reports collected across North America, Europe, and Asia-Pacific markets. Observers note that temperature swings, precipitation events, and storm systems often align with shifts in session durations and player volumes for games such as blackjack, roulette, and baccarat. Data from platform analytics firms indicates these correlations appear most consistent during extreme weather periods rather than mild seasonal transitions.
Regional Data Patterns Across Platforms
Studies compiled by research groups in the United States reveal that prolonged cold snaps in northern states correspond with increased logins to digital table game servers, while similar upticks occur during heatwaves in southern regions where outdoor activities decline. In contrast, coastal areas experience different trends when hurricane warnings prompt residents to seek indoor entertainment options. Australian meteorological records paired with gaming traffic logs demonstrate that heavy rainfall periods in Queensland and New South Wales link to elevated participation in virtual poker variants across several major sites. Canadian provincial data further supports these observations, with winter storm events in Ontario and Alberta producing noticeable spikes in table game engagement that persist for several days after the weather clears.
Mechanisms Behind the Observed Shifts
Platform operators track how weather influences daily routines, leading users to substitute outdoor plans with extended online sessions when mobility decreases. Researchers at multiple institutions have documented that smartphone and desktop access rates rise during work-from-home advisories triggered by severe conditions, creating longer continuous play windows for table games. Network latency reports from service providers show stable connections during most weather events, suggesting that technical barriers rarely offset the behavioral surge. Those who analyze user retention metrics across platforms find that promotional offers timed with forecast disruptions often amplify the natural weather-driven increases rather than create them independently.
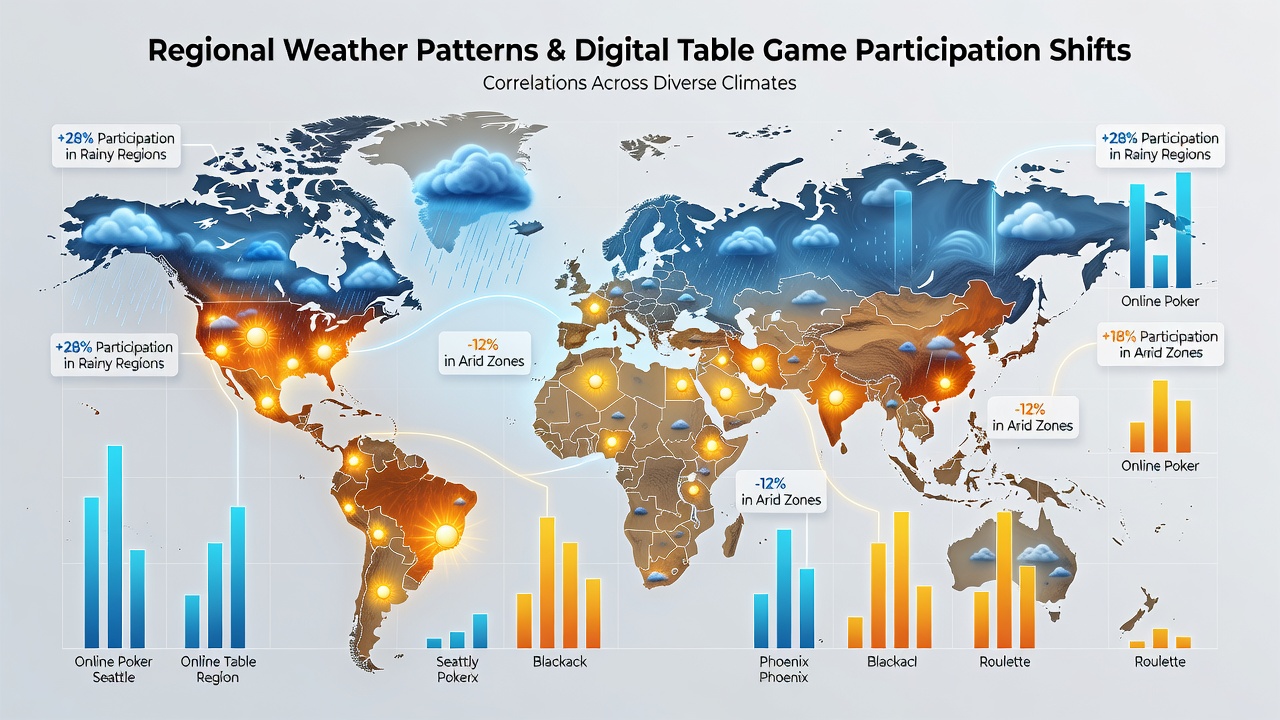
August 2026 brought several notable examples where European heat records coincided with cross-platform migration toward climate-controlled digital environments. Participation figures from operators serving Mediterranean and Central European users showed consistent growth in evening table game hours, aligning with daytime temperature peaks that discouraged outdoor movement. Similar patterns emerged in parts of Southeast Asia where monsoon activity overlapped with holiday periods, producing measurable lifts in mobile table game traffic on both Android and iOS ecosystems.
Platform-Specific Observations and Cross-Market Comparisons
Different digital environments register weather correlations at varying intensities. Desktop-focused platforms often record steadier session lengths during extended weather events, whereas mobile applications see more fragmented but frequent logins when users check weather updates between rounds. Aggregated figures from industry reports highlight that multi-platform users tend to switch devices based on power availability during outages, yet overall table game volume remains elevated until conditions normalize. A National Oceanic and Atmospheric Administration climate summary from mid-2026 illustrates how regional temperature anomalies tracked closely with gaming server load metrics supplied by several operators. Another dataset released by the Canadian Gaming Association compared provincial weather logs against participation rates and identified parallel movements in blackjack and roulette activity during both summer and winter extremes.
Future Monitoring and Data Integration
Operators continue integrating real-time weather feeds into their analytics dashboards to anticipate demand fluctuations and adjust server capacity accordingly. Academic teams examining longitudinal datasets note that predictive models improve when they incorporate humidity levels alongside precipitation and temperature variables. Cross-border comparisons reveal that regulatory environments influence how openly these correlations appear in public reports, yet the underlying activity patterns remain consistent across jurisdictions. As platforms expand their geographic reach, the ability to correlate localized forecasts with user behavior strengthens the case for weather as one measurable factor among several that shape digital table game engagement.
Conclusion
Available records demonstrate that regional weather events produce detectable shifts in digital table game participation across numerous platforms, with patterns repeating across continents and seasons. Continued collection of synchronized meteorological and usage data will refine understanding of these relationships without requiring subjective interpretation. The evidence accumulated through 2026 supports treating weather as a consistent external variable in operational planning for online gaming services.